CGO Performance In Go 1.21
Tl;Dr⌗
Cgo calls take about 40ns, about the same time encoding/json takes to parse a single digit integer. On my 20 core machine
Cgo call performance scales with core count up to about 16 cores, after which some known contention issues slow things down.
Disclaimer⌗
While alot of this article argues that “Cgo performance is good actually”, please don’t take that to mean “Cgo is good actually”. I’ve maintained production applications that use Cgo and non-trivial bindings to lua. Performance was great. Go upgrades were a regular source of toil. The drawback to using Cgo is losing Go cross compilation benefits and having to manage c dependencies. These days I mainly use Cgo for compatibility and to access libraries that happen to be written in C/C++.
Cgo & performance⌗
Cgo performance is poorly understood in Go, and searching for information online mixes content from 2 years ago with content from 7 years ago. Cockroach labs wrote a great article that measured performance and touched on the complexities of using Cgo. Since then Go performance has improved quite a but, but everything else they said is relevant. My similar benchmarks are 17x faster than what Cockroach labs saw in 2015. Some of that might be hardware by suspect most of it is just improvements to Go. Unfortunately I see alot of Go programmers have internalized that “Cgo is slow” without really knowing what it’s slow compared to. Cgo is slow compared to a regular function call. It’s certainly not slow compared to doing any sort of I/O or parsing work.
In this post I want to build on the idea of “latency numbers every programmer should know” to figure out where in the context of “slow” Cgo lands in the heirarchy of L1 cache reference -> mutex lock -> main memory reference -> sending a packet on the network. These numbers are from 2012 so they are really just here to give us a sense of scale:
| latency comparison numbers | |
|---|---|
| L1 cache reference | 0.5 ns |
| Branch mispredict | 5 ns |
| L2 cache reference | 7 ns |
| Mutex lock/unlock | 25 ns |
| Main memory reference | 100 ns |
| Compress 1K bytes with Zippy | 3,000 ns 3 us |
| Send 1K bytes over 1 Gbps network | 10,000 ns 10 us |
| Read 4K randomly from SSD* | 150,000 ns 150 us |
| Read 1 MB sequentially from memory | 250,000 ns 250 us |
| Round trip within same datacenter | 500,000 ns 500 us |
My thesis is: Cgo is has overhead, but it doesn’t have as much overhead as it used to and it may not have as much overhead as you think.
Lets talk about what Cgo is and a teeny bit about how it works. Cgo is essentially Go’s ffi. When you use Cgo you can call C functions from Go and pass information back and forth (subject to some rules). The Go compiler autogenerates some functions to bridge between the Go & C and handle things like differences in platform calling conventions. There are also mismatches in how blocking calls are handled and how stack is allocated that make it impractical/unsafe to run Go and C code on the same stack. I won’t go too much into the implementation but at a high level “Cgo means IPC between threads” is a good mental model.
Benchmarking⌗
Lets write some benchmarks to explore performance . You can follow along at github.com/shanemhansen/cgobench. The code in the repo is autogenerated from the source org file for this article using an implementation of Knuth’s literate programming. Is it the most productive way to write articles? Probably not, but it’s fun and frankly playing around with new workflows helps my ADHD brain focus. But I digress.
First off we’ll put a no-op go function in bench.go and do a parallel benchmark. It doesn’t do anything
which is a great place to start.
bench.go
func Call() {
        // do less
}
Now we’ll add a simple parallel benchmark helper along with our empty call benchmark. I’m going to start out with something so simple the compiler can inline and then compare that to a non-inlined call. When comparing Go vs Cgo it’s important to realize that the Go compiler can’t inline Cgo functions.
bench_test.go
// helper to cut down on boilerplate
func pbench(b *testing.B, f func()) {
        b.RunParallel(func(pb *testing.PB) {
                for pb.Next() {
                        f()
                }
        })

}
// Same as above, but explicitly calling the inlineable Call func.
func BenchmarkEmptyCallInlineable(b *testing.B) {
        b.RunParallel(func(pb *testing.PB) {
                for pb.Next() {
                        Call()
                }
        })
}
func BenchmarkEmptyCall(b *testing.B) {
        pbench(b, Call)
}
In the case of benchmarking no-ops it’s always good to check and make sure your code didn’t get completely optimized away.
I tend to just look at the disassembled output in BenchmarkEmptyCall and sure enough I see a convincing call *%rax instruction in the assembly. A non dynamic
dispatch version would look like: call foo+0x3 but this version is calling a function who’s address is in the rax register.
Let’s compile and examine:
go test -c
objdump -S cgobench.test  | grep -A15 '^0.*/cgobench.BenchmarkEmptyCall.pbench.func'
0000000000522920 <github.com/shanemhansen/cgobench.BenchmarkEmptyCall.pbench.func1>:
	b.RunParallel(func(pb *testing.PB) {
  522920:	49 3b 66 10          	cmp    0x10(%r14),%rsp
  522924:	76 36                	jbe    52295c <github.com/shanemhansen/cgobench.BenchmarkEmptyCall.pbench.func1+0x3c>
  522926:	55                   	push   %rbp
  522927:	48 89 e5             	mov    %rsp,%rbp
  52292a:	48 83 ec 18          	sub    $0x18,%rsp
  52292e:	48 89 44 24 10       	mov    %rax,0x10(%rsp)
  522933:	48 8b 4a 08          	mov    0x8(%rdx),%rcx
  522937:	48 89 4c 24 08       	mov    %rcx,0x8(%rsp)
		for pb.Next() {
  52293c:	eb 0f                	jmp    52294d <github.com/shanemhansen/cgobench.BenchmarkEmptyCall.pbench.func1+0x2d>
			f()
  52293e:	48 8b 54 24 08       	mov    0x8(%rsp),%rdx
  522943:	48 8b 02             	mov    (%rdx),%rax
  522946:	ff d0                	call   *%rax
Now that we’ve verified our benchmark we can run it. I’m going to run benchmarks with a few different coure count values so we can see how the output changes. While writing this post I experimented with some other values and for most benchmarks performance increased linearly with core count up to 16 before it began falling off. On my machine with 20 cores the overhead of the dynamic call is around 1ns and the inlinable version is significantly faster. As expected.
go test -cpu=1,2,4,8,16 -bench EmptyCall
goos: linux
goarch: amd64
pkg: github.com/shanemhansen/cgobench
cpu: 12th Gen Intel(R) Core(TM) i7-12700H
BenchmarkEmptyCallInlineable       	1000000000	         0.2784 ns/op
BenchmarkEmptyCallInlineable-2     	1000000000	         0.1383 ns/op
BenchmarkEmptyCallInlineable-4     	1000000000	         0.07377 ns/op
BenchmarkEmptyCallInlineable-8     	1000000000	         0.04089 ns/op
BenchmarkEmptyCallInlineable-16    	1000000000	         0.02481 ns/op
BenchmarkEmptyCall                 	718694536	         1.665 ns/op
BenchmarkEmptyCall-2               	1000000000	         0.8346 ns/op
BenchmarkEmptyCall-4               	1000000000	         0.4443 ns/op
BenchmarkEmptyCall-8               	1000000000	         0.2385 ns/op
BenchmarkEmptyCall-16              	1000000000	         0.1399 ns/op
PASS
ok  	github.com/shanemhansen/cgobench	3.819s
So now I can think of “go function call” cost as “a little more expensive than a L1 cache reference” in the above table. What happens if we add a Cgo call?
Below is a trivial c function to add 2 integers and a go function to call it. Note that although we might expect gcc to inline trivial_add, we don’t expect Go’s compiler to. I did play with some even simpler C functions but they didn’t really perform better.
bench.go
int trivial_add(int a, int b) {
  return a+b;
}
// wow this is easy
// import "C"
func CgoCall() {
        C.trivial_add(1,2)
}
bench_test.go
func BenchmarkCgoCall(b *testing.B) {
        pbench(b, CgoCall)
}
We run benchmarks in the usual way. Single threaded Cgo overhead is about 40ns. Performance seems to scale linearly with the number of cores up to 16ish so if I had a Cgo-bound workload I might not bother putting it on a machine with 32 core, but real workloads usually involve more than just calling a cgo func. We can see:
- Cgo has 40ns overhead. That sits somewhere between “mutex lock” and “main memory reference”.
- 40ns/op is 25 million ops/s. That’s pretty good for most projects I’ve worked on. At 4ns/op and 16 cores we’re getting 250 million ops/s.
go test -cpu=1,2,4,8,16,32 -bench Cgo
goos: linux
goarch: amd64
pkg: github.com/shanemhansen/cgobench
cpu: 12th Gen Intel(R) Core(TM) i7-12700H
BenchmarkCgoCall       	28711474	        38.93 ns/op
BenchmarkCgoCall-2     	60680826	        20.30 ns/op
BenchmarkCgoCall-4     	100000000	        10.46 ns/op
BenchmarkCgoCall-8     	198091461	         6.134 ns/op
BenchmarkCgoCall-16    	248427465	         4.949 ns/op
BenchmarkCgoCall-32    	256506208	         4.328 ns/op
PASS
ok  	github.com/shanemhansen/cgobench	8.609s
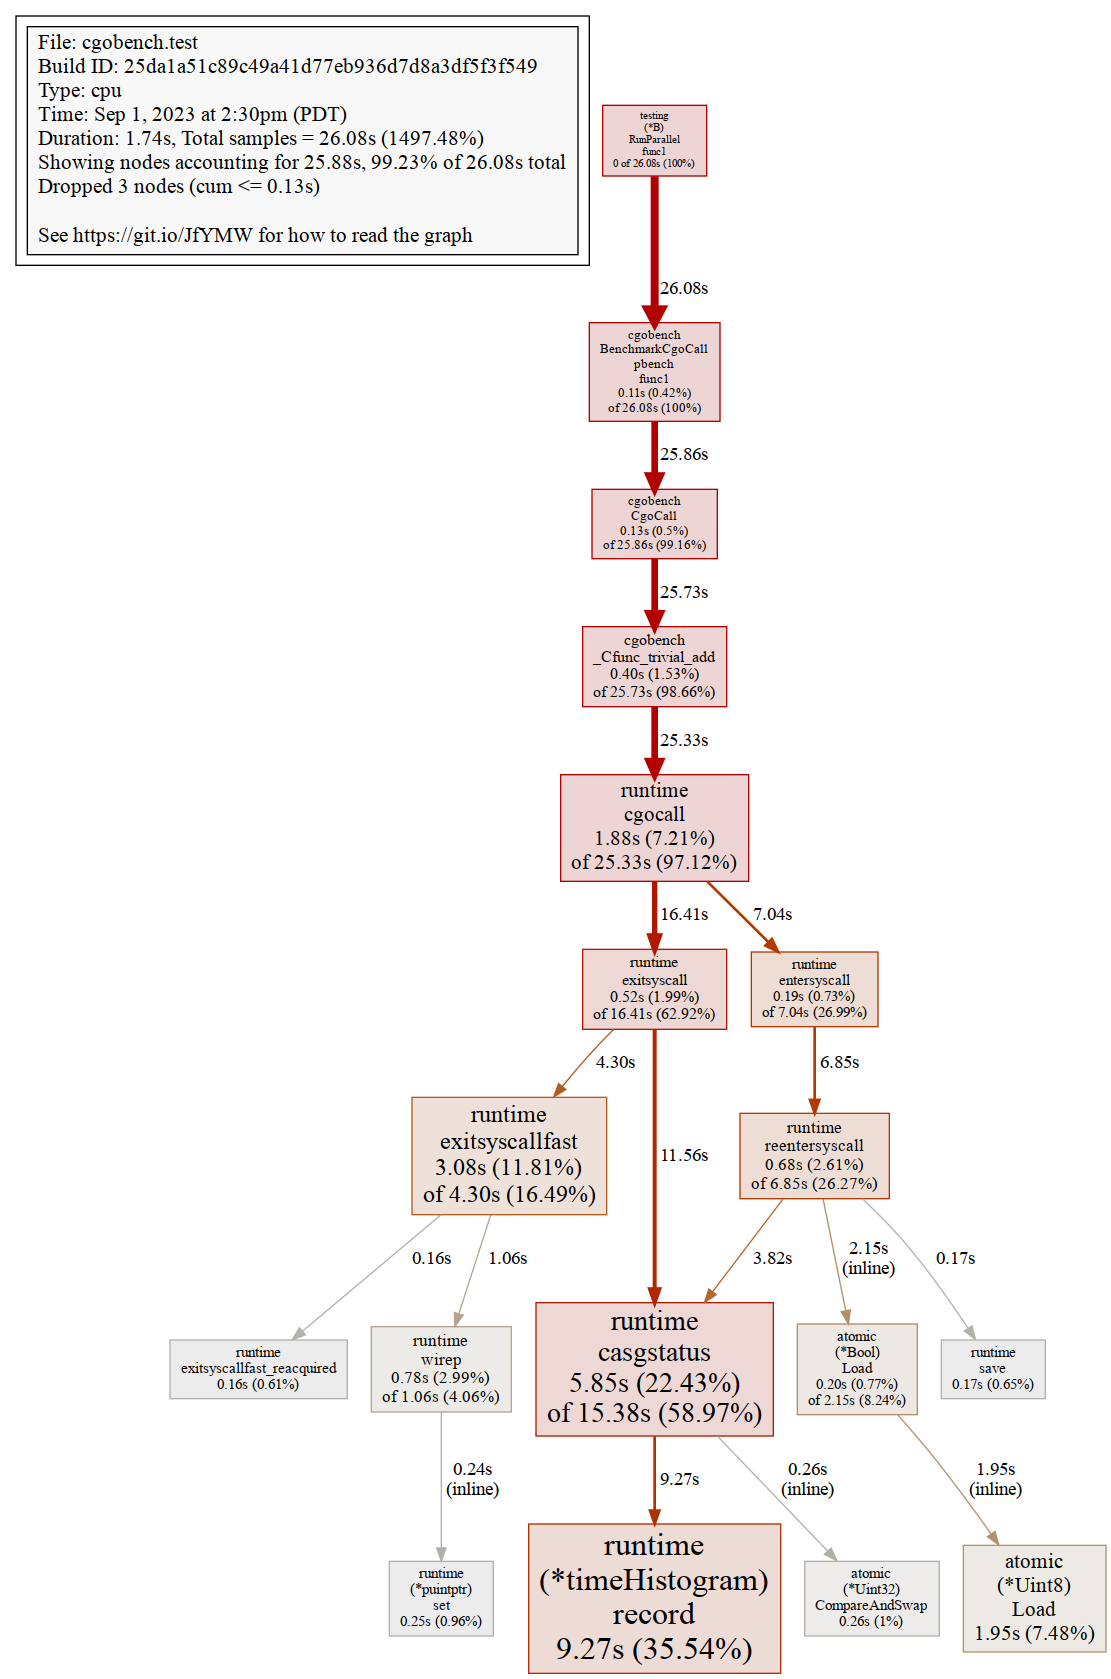
Now I want to understand a little bit more about why performance is that way. We’ll use Go’s great profiling tools to get a better picture of performance at higher core counts. I’m a fan of the pprof web view,
which tells us that runtime.(*timeHistorgram).record and runtime.casgstatus are taking lots of time. This
tracks with Ian Lance Taylor’s observations. Interestingly he doesn’t expect these operations to be contended,
so there’s potential for improving performance.
Running the test and collecting results:
go test -c
./cgobench.test  -test.cpuprofile=c.out -test.cpu=16 -test.bench Cgo
go tool pprof -png cgobench.test c.out > cpu.png
goos: linux
goarch: amd64
pkg: github.com/shanemhansen/cgobench
cpu: 12th Gen Intel(R) Core(TM) i7-12700H
BenchmarkCgoCall-16    	235322289	         4.955 ns/op
PASS
Note the 2 large boxes near the bottom:
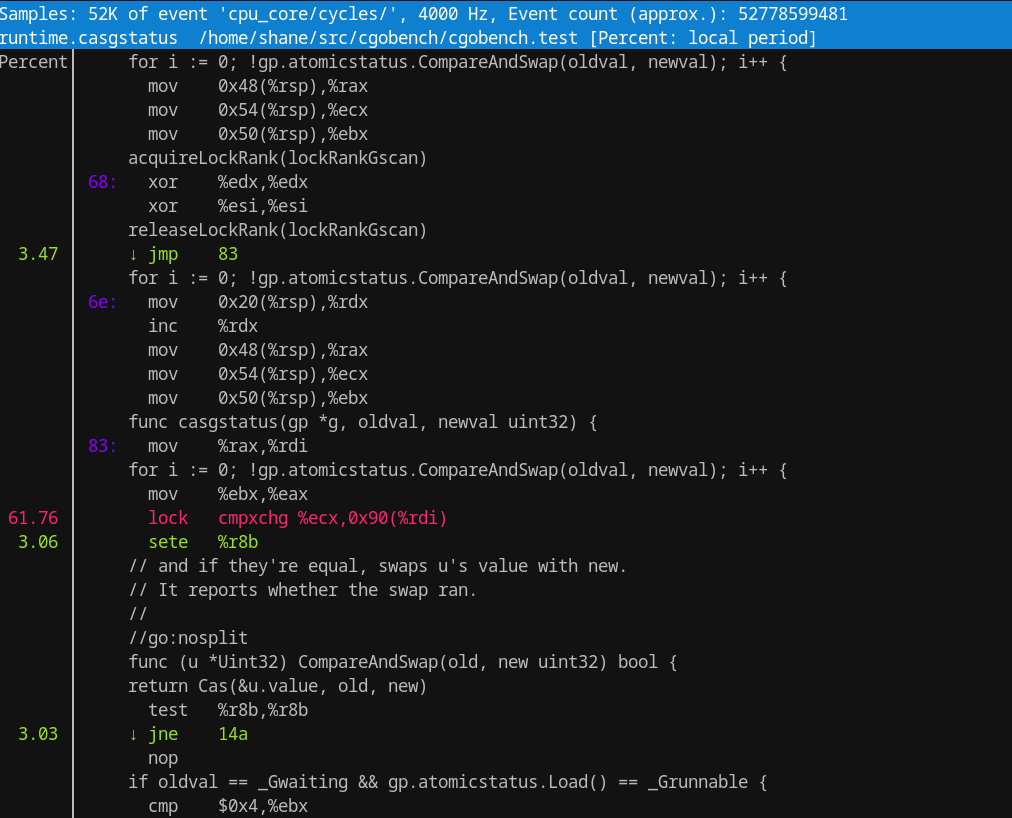
I also use linux perf. It does a good job of being able to profile cross language stuff for compiled languages as well as combining both userspace and kernel performance info.
A quick snapshot of (one of) the hot instructions in question in question from perf:
Before we put it all together I’ll add one final piece of data in to help us get perspective. Here’s a carefully crafted JSON decoding benchmark that just parses an integer. It’s
written using json.NewDecoder because just json.Unmarshal allocates too much. What you’ll see below is that a Cgo call is 20% cheaper than a trivial JSON parse using the standard
library in both single threaded and parallel tests.
bench_test.go
func BenchmarkJSONCall(b *testing.B) {
        msg := `1`
        b.RunParallel(func(pb *testing.PB) {
                var dst int
                r := strings.NewReader(msg)
                dec := json.NewDecoder(r)
                for pb.Next() {
                        r.Seek(0, io.SeekStart)
                        if err := dec.Decode(&dst); err != nil {
                                panic(err)
                        }
                }
        })
}
go test -cpu=1,16 -bench JSON
goos: linux
goarch: amd64
pkg: github.com/shanemhansen/cgobench
cpu: 12th Gen Intel(R) Core(TM) i7-12700H
BenchmarkJSONCall       	21399691	        52.79 ns/op
BenchmarkJSONCall-16    	217874599	         5.471 ns/op
PASS
ok  	github.com/shanemhansen/cgobench	2.942s
Conclusions⌗
So at this point we’ve measured performance overhead of Cgo, at least in terms of wall clock time (note that we haven’t looked at memory/thread count/battery usage/etc). We know that the overhead is on the order of 2 mutex operations and that it does scale with number of cores up to around 16. We’ve also seen that with 16 cores we can do around 4ns/op or close to 250 million Cgo ops/s. So if I was looking at using Cgo in 2023 I’d definitely use it outside of very hot loops. There’s many reasons I wouldn’t use Cgo in 2023 (see disclaimer), but performance is unlikely to be one of them.
I’ll end with this little Cgo version of “latency numbers every programmer should know” table:
| Go/Cgo latency | ||
|---|---|---|
| Benchmark Name | 1 core | 16 cores |
| Inlined Empty func | 0.271 ns | 0.02489 ns |
| Empty func | 1.5s ns | 0.135 ns |
cgo | 40 ns | 4.281 ns |
| encoding/json int parse | 52.89 ns | 5.518 ns |